
Page View Visualizer
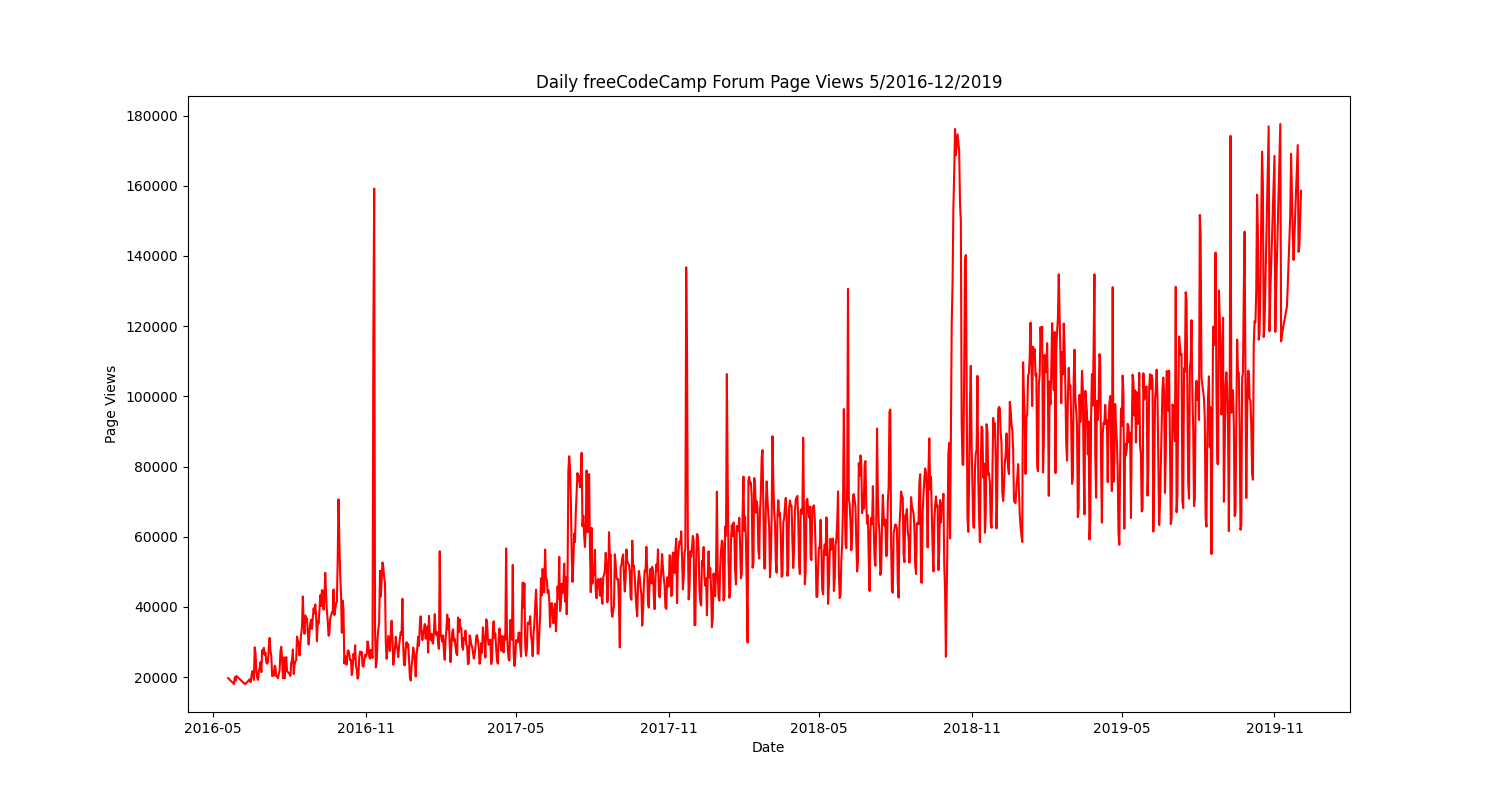
In this analysis, We will be visualizing time series data using a line chart, bar chart and box plots. The data we are looking at will be the number of page views each day on freeCodeCamp.org forum from 2016-05-09 to 2019-12-03.
The dataset that we have consists of 1304 rows and 2 columns, ‘date’ and ‘value’ which shows the number of visits in the day.
The steps taken to do the plot is as follow:
- Read in the data from the csv file with pandas and parse the date column. Note that when you parse the date column, the data type changes.
- Plot the line graph with matplotlib
- Make a copy of the data frame and convert the date column to string so that you can carry out string manipulation
- Once the date column is in string format, you can manipulate it and apply groupby function to generate the bar plot.
- Plot the bar graph using seaborn catplot function. Note that seaborn is a visualization library and you can think of it as an extension to matplotlib
- Make a copy of the data frame like before.
- Plot the box plots using seaborn boxplot function.
If you would like to find out more about my python code, check out the repo here
Analysis:
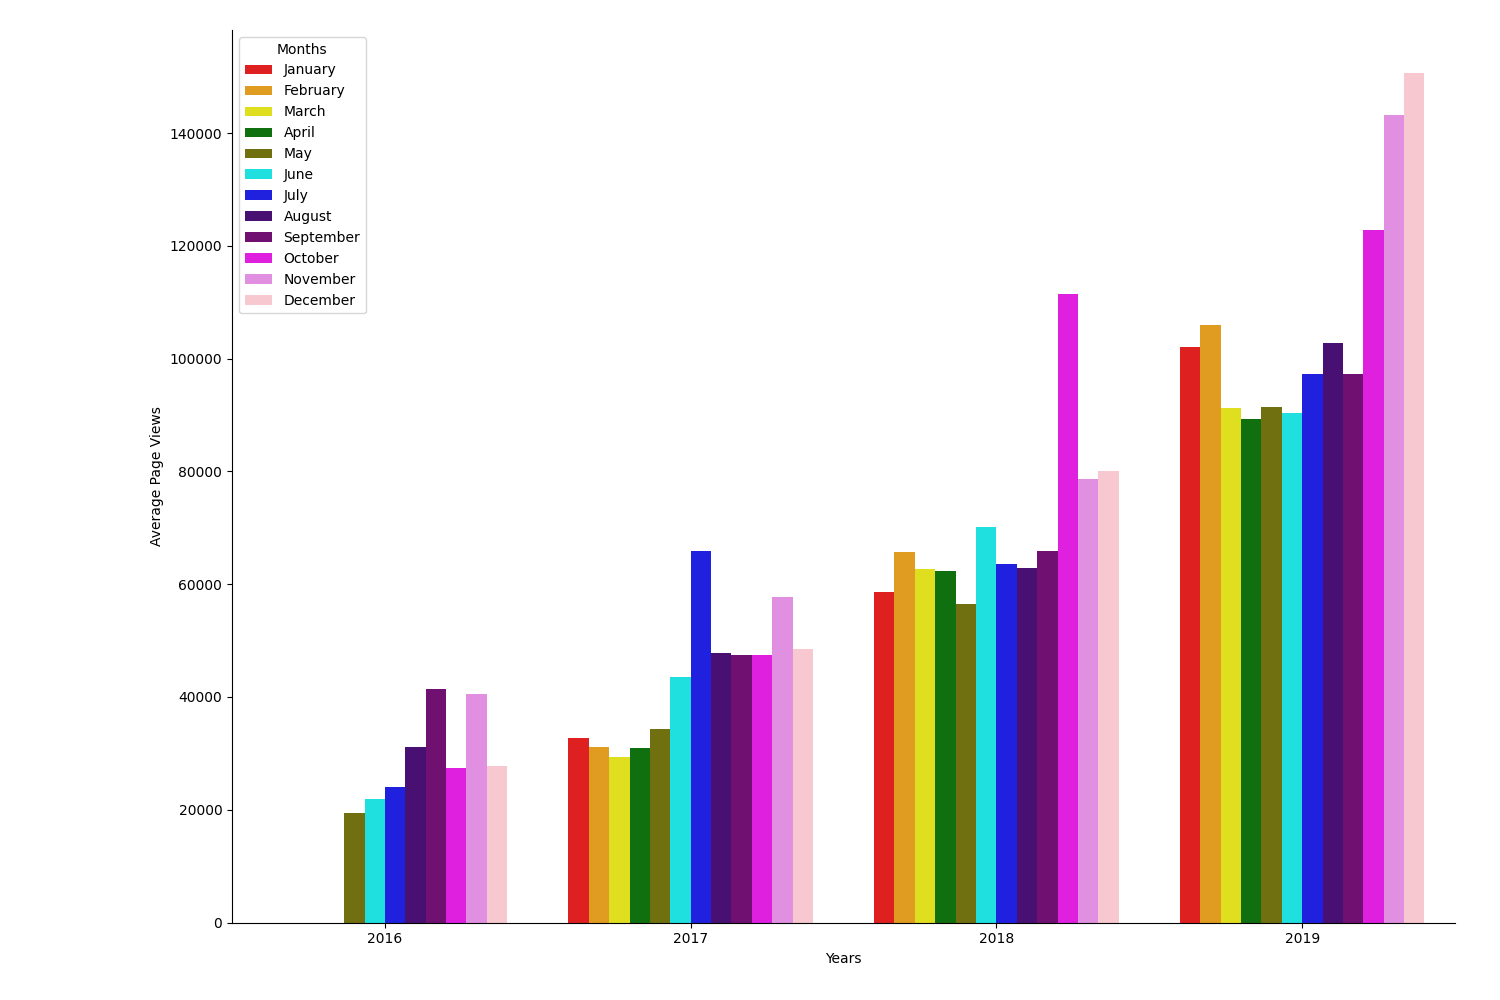
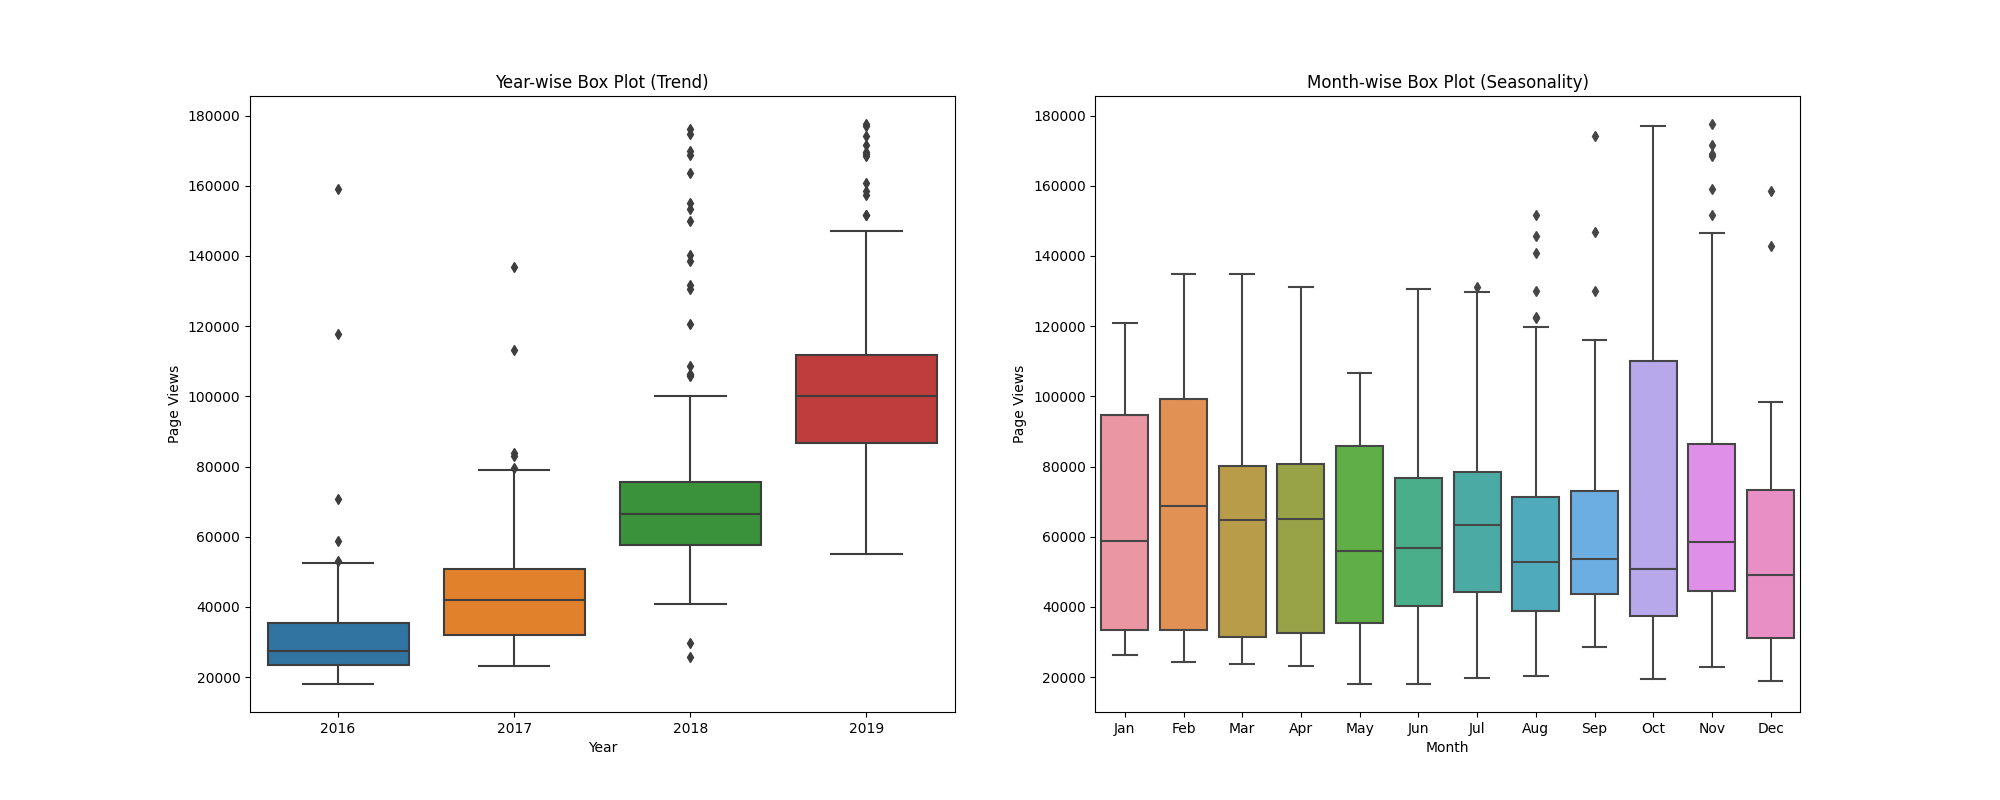
So based on the 3 plots that we have, we can see that there is clearly an upward trend over the years and this is not a linear growth. So we can see that there is probably a growing demand for web development that more and more people are learning web development.
From the bar chart and the month-wise box plot, we can see that there is somewhat a seasonality to the increase. We can see that in the last quarter of the year there is usually an increase in page views on the forum. So we can guess that in the last quarter of the year, people could be looking at the forums because:
- People want to learn web development as a growing requirement for their jobs.
- People could be preparing for a career change.
- Office work could be slowing down as the year closes and people have more time to focus on personal growth.
So if I were an educator or if I were conducting training in the IT sector, I know that business is good and will continue to grow in the near future and that my business has a certain seasonality to it and I should be aggressive on my Christmas or year end sales strategy.